
NASA Reveals the Movement and Distribution of Carbon Dioxide on Earth with a Spectacular Video
Carbon dioxide (CO2) is one of the main greenhouse gases that contributes to global warming. It is emitted by human activities such as burning fossil fuels, deforestation, and agriculture. It is also absorbed by natural processes such as photosynthesis and ocean uptake. However, the balance between sources and sinks of CO2 has been disrupted by human activities, leading to an increase in atmospheric CO2 concentration and global temperature.
NASA has recently released a new set of videos that visualize the emission and movement of CO2 all around the Earth over the course of 2021. The videos use an ultra-high-resolution computer model that simulates the atmospheric circulation and transport of CO2 with unprecedented detail and accuracy. The videos show how CO2 from different sources travels across the globe with the winds, and how it varies with seasons and regions.
In this blog post, we will explore some of the key features and insights from these videos, and discuss their implications for climate change mitigation and adaptation.
Methodology
The videos are based on a simulation run by NASA’s Goddard Earth Observing System Forward Processing (GEOS FP) model, which is a state-of-the-art global atmospheric model that incorporates data from satellites, ground stations, aircrafts, and other sources. The model has a spatial resolution of about 6 kilometers (4 miles), which is 64 times finer than typical climate models. This allows the model to capture small-scale features such as urban plumes, biomass burning emissions, and mountain breezes.
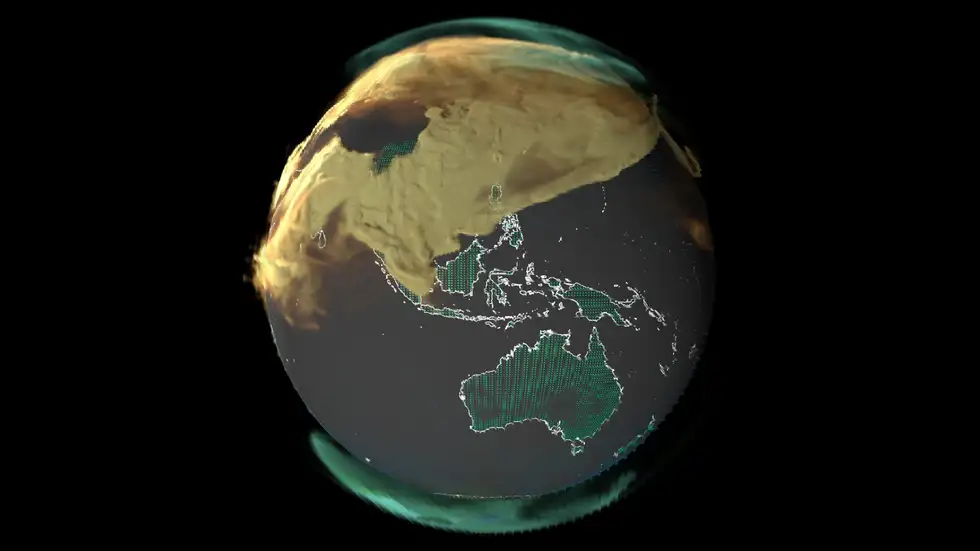
The model also includes a tracer transport module that tracks the movement of CO2 and other gases in the atmosphere. The module accounts for various processes that affect CO2 concentration, such as emissions, chemical reactions, deposition, and diffusion. The module uses four tracers to represent different sources of CO2: fossil fuels (orange), biomass burning (red), land ecosystems (green), and ocean (blue). The tracers are initialized with observed values from 2020, and then updated with estimated emissions and fluxes for 2021.
The videos show the distribution of CO2 at an altitude of about 500 meters (1,600 feet) above the surface, where most of the emissions occur. The videos cover three regions: global, North America, and Asia. Each video spans one year, from January 1 to December 31, 2021. Each five seconds in the video represent approximately 20 days in real time.
Results
The videos reveal some interesting patterns and trends of CO2 emission and movement around the world. Here are some of the highlights:
- The global video shows that fossil fuels are the dominant source of CO2 emissions throughout the year, especially in the northern hemisphere where most of the industrialized countries are located. The major hotspots of fossil fuel emissions are China, India, Europe, and the eastern United States. The fossil fuel emissions tend to peak in winter when energy demand is higher for heating and lighting.
- The biomass burning video shows that fires are another significant source of CO2 emissions, especially in Africa where most of the agricultural burning occurs. The biomass burning emissions tend to peak in late summer when vegetation is dry and susceptible to ignition. The biomass burning emissions also vary with weather conditions such as wind speed and direction.
- The land ecosystems video shows that plants play an important role in regulating CO2 concentration by absorbing CO2 during photosynthesis and releasing it during respiration. The land ecosystems act as a net sink of CO2 in spring and summer when plants grow rapidly, and as a net source of CO2 in autumn and winter when plants decay or go dormant. The land ecosystems also show seasonal cycles that reflect the differences in vegetation types and climate zones.
- The ocean video shows that the ocean also acts as a major sink of CO2 by dissolving CO2 from the atmosphere into seawater. The ocean uptake of CO2 depends on factors such as sea surface temperature, salinity, and biological activity. The ocean uptake of CO2 tends to be higher in colder regions where the water can hold more CO2, and lower in warmer regions where the water can hold less CO2.
- The videos also show how CO2 from different sources mixes and spreads in the atmosphere with the winds. The winds can transport CO2 over long distances, sometimes across continents and oceans. The winds can also create eddies and swirls that enhance the mixing of CO2. The winds can also influence the local concentration of CO2 by bringing in air from different regions.
Discussion
The videos provide a stunning and informative visualization of the emission and movement of CO2 all around the Earth. They help us understand how human activities and natural processes affect the global carbon cycle and climate system. They also help us identify the regions and sectors that contribute most to CO2 emissions, and the regions and sectors that are most vulnerable to CO2 impacts.
The videos also highlight the urgency and complexity of tackling climate change. They show that CO2 emissions are widespread and persistent, and that they have global consequences. They show that reducing CO2 emissions requires coordinated action from multiple actors at multiple scales, from individuals to governments, from local to international. They show that enhancing CO2 sinks requires careful management of land and ocean resources, as well as protection of biodiversity and ecosystems.
The videos are not only a scientific tool, but also a communication tool. They can help raise awareness and educate the public about the causes and effects of climate change. They can also inspire action and innovation to reduce CO2 emissions and increase CO2 sinks. They can also foster collaboration and dialogue among stakeholders and communities to find solutions and opportunities for a low-carbon future.
Conclusion
In conclusion, NASA has created a new set of videos that depict the emission and movement of CO2 all around the Earth over the course of 2021. The videos use an ultra-high-resolution computer model that simulates the atmospheric circulation and transport of CO2 with unprecedented detail and accuracy. The videos show how CO2 from different sources travels across the globe with the winds, and how it varies with seasons and regions.
The videos reveal some interesting patterns and trends of CO2 emission and movement around the world. They also provide some insights and implications for climate change mitigation and adaptation. The videos are not only a scientific tool, but also a communication tool. They can help us understand, communicate, and act on climate change.